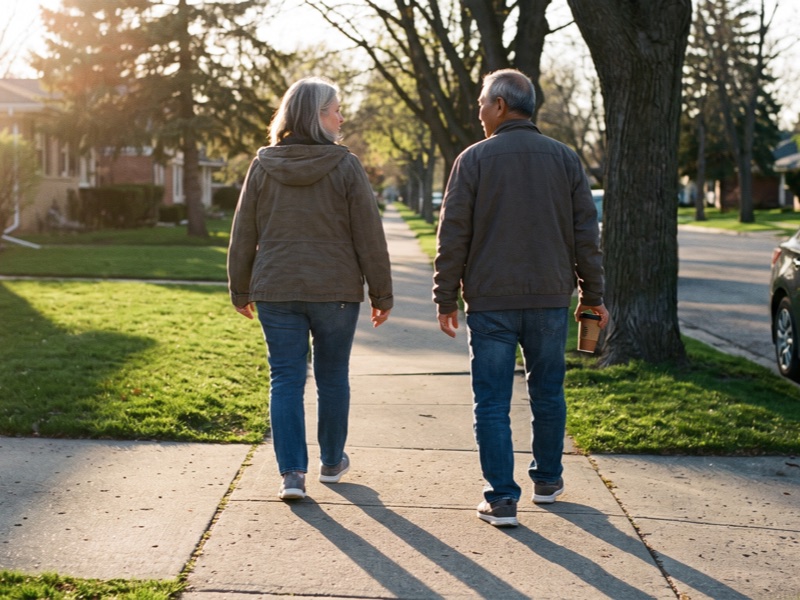
The 10-minute walk after meals: what it does to your blood sugar
The trial numbers, why timing matters more than distance, and how to fit three short walks into a normal workday.
Enter an A1c or an average blood sugar and get the other, in mg/dL and mmol/L, with the ADA category and the IFCC mmol/mol value labs outside the US report.
eAG uses the ADAG formula (28.7 × A1c − 46.7) and the categories use the ADA cutoffs of 5.7 % and 6.5 %. The estimate is a population average; your own average glucose may sit about 30 mg/dL higher or lower. Only a lab test, confirmed by a second one, diagnoses prediabetes or diabetes.
Type in either number and the calculator fills in the other. It uses the ADAG formula from a 2008 Diabetes Care study, the same one behind the American Diabetes Association's A1c to glucose converter: estimated average glucose (eAG) in mg/dL = 28.7 × A1c − 46.7. Run backward, average blood sugar to A1c is (eAG + 46.7) ÷ 28.7. The study matched three months of continuous glucose readings from 507 people to their A1c, so the result is the average glucose that people with your A1c tended to have, an estimate.
Two extra lines appear with the result. The mg/dL to mmol/L blood sugar conversion divides by 18.0182, so 140 mg/dL is 7.8 mmol/L. The IFCC value in mmol/mol is how most countries outside the US report A1c; the NGSP master equation, rearranged, gives IFCC = 10.93 × A1c − 23.5, so 6.5 % is 48 mmol/mol.
A1c is the share of your hemoglobin that has glucose attached to it. Red blood cells live about 120 days, so the test reflects roughly three months of blood sugar, but not evenly: the most recent four to six weeks contribute about half of the number, the oldest month the least.
eAG is a round-the-clock average over weeks, not a fasting glucose. Someone with an eAG of 126 mg/dL may wake up at 100 and spend afternoons at 160. Compare it with a CGM's 14-day average, not a single morning meter check.
What is a normal A1c? Under 5.7 %. The ADA draws its lines at 5.7 % and 6.5 %: 5.7 to 6.4 % is prediabetes, and 6.5 % or higher, confirmed by a second test, is diabetes. The table is the A1c conversion chart most people are searching for, with the ADAG average glucose and the IFCC value for each step.
| A1c (%) | eAG (mg/dL) | eAG (mmol/L) | IFCC (mmol/mol) | ADA category |
|---|---|---|---|---|
| 5.0 | 97 | 5.4 | 31 | Normal |
| 5.5 | 111 | 6.2 | 37 | Normal |
| 6.0 | 126 | 7.0 | 42 | Prediabetes |
| 6.5 | 140 | 7.8 | 48 | Diabetes |
| 7.0 | 154 | 8.6 | 53 | Diabetes |
| 7.5 | 169 | 9.4 | 58 | Diabetes |
| 8.0 | 183 | 10.2 | 64 | Diabetes |
| 8.5 | 197 | 10.9 | 69 | Diabetes |
| 9.0 | 212 | 11.7 | 75 | Diabetes |
| 9.5 | 226 | 12.5 | 80 | Diabetes |
| 10.0 | 240 | 13.3 | 86 | Diabetes |
| 10.5 | 255 | 14.1 | 91 | Diabetes |
| 11.0 | 269 | 14.9 | 97 | Diabetes |
| 11.5 | 283 | 15.7 | 102 | Diabetes |
| 12.0 | 298 | 16.5 | 108 | Diabetes |
The two most-searched values: an A1c 5.7 is about 117 mg/dL (6.5 mmol/L) and 39 mmol/mol, the first step of prediabetes. An A1c 6.5 is about 140 mg/dL (7.8 mmol/L) and 48 mmol/mol, the diabetes threshold, which the ADA confirms with a second abnormal test.
| Test | Normal | Prediabetes | Diabetes |
|---|---|---|---|
| A1c | Below 5.7 % | 5.7 to 6.4 % | 6.5 % or higher |
| Fasting plasma glucose (no calories for 8 hours) | Below 100 mg/dL (5.6 mmol/L) | 100 to 125 mg/dL (5.6 to 6.9) | 126 mg/dL (7.0) or higher |
| 2-hour plasma glucose, 75 g oral glucose tolerance test | Below 140 mg/dL (7.8 mmol/L) | 140 to 199 mg/dL (7.8 to 11.0) | 200 mg/dL (11.1) or higher |
| Random plasma glucose with classic symptoms | — | — | 200 mg/dL (11.1) or higher |
The eAG formula is a population average. In the ADAG data, 95 % of people with an A1c of 7.0 % had a true average glucose between about 123 and 185 mg/dL, roughly plus or minus 30 mg/dL around the 154 the calculator shows. A CGM average 20 mg/dL away from your eAG is not a malfunction.
Iron-deficiency anemia tends to push A1c up. Hemolytic anemia, recent significant blood loss, a transfusion in the past three months and erythropoietin treatment tend to push it down. Advanced kidney disease can move it either way. Hemoglobin variants such as sickle cell trait, HbC, HbD and HbE, more common in people of African, Mediterranean and Southeast Asian descent, interfere with some lab methods. In these situations the ADA says to diagnose with glucose tests, not A1c. Pregnancy speeds up red cell turnover and lowers A1c in the second and third trimesters, one reason gestational diabetes is screened with an oral glucose tolerance test instead.
The categories here are diagnostic cutoffs, not treatment goals. For many nonpregnant adults with diabetes the ADA suggests an A1c under 7 %, but it explicitly allows looser goals, such as under 8 %, for older adults and people with other conditions, limited life expectancy or a history of severe hypoglycemia. A 7.6 % may be the right number for a 78-year-old on insulin; that is the prescriber's call. And this page diagnoses nothing. A lab draw does, and it takes two.
Not a ranking, in no particular order. How we make money.
Over-the-counter CGM for adults not on insulin; its 14- or 15-day average is the closest thing to your eAG you can see at home, but it has no low-glucose alarms and is not meant for people who take insulin.
The cheap option and one of the most accurate meters in independent testing; a fasting reading plus one two hours after breakfast tells you a lot, but single readings are not an average and will not match your eAG.
A five-minute fingerstick A1c at home, NGSP-certified; useful for watching a trend between lab visits, but point-of-care results can differ from a venous lab draw by several tenths of a point and cannot diagnose diabetes.
The American Diabetes Association defines normal as an A1c below 5.7 %. From 5.7 to 6.4 % is prediabetes, and 6.5 % or higher, confirmed on a second test, is diabetes. In IFCC units that is below 39 mmol/mol, 39 to 47, and 48 or above. People who already have diabetes are judged against a personal target, often under 7 %, not against the normal range.
Multiply the A1c by 28.7 and subtract 46.7 to get estimated average glucose in mg/dL; divide that by 18 for mmol/L. An A1c of 7.0 % works out to about 154 mg/dL or 8.6 mmol/L. The formula comes from the ADAG study of 507 people and gives a population average, so your own average may be about 30 mg/dL higher or lower.
It is the first number in the prediabetes range and corresponds to an average glucose of about 117 mg/dL. It is not diabetes, and it is not a diagnosis on its own; labs vary by a few tenths, so a clinician will usually repeat it. It is the range where a walk after meals, more protein early in the day and modest weight loss have the strongest evidence for pushing the number back down.
6.5 % is the ADA threshold for diabetes, equal to an average glucose of about 140 mg/dL (7.8 mmol/L) or 48 mmol/mol. Unless your glucose is clearly very high, the diagnosis needs a second abnormal result, either a repeat A1c or a fasting or oral glucose tolerance test. Anemia, hemoglobin variants and kidney disease can push A1c up or down, which is another reason to confirm it.
Divide mg/dL by 18 to get mmol/L, or multiply mmol/L by 18 to get mg/dL; the exact factor is 18.0182. So 100 mg/dL is 5.6 mmol/L, 126 mg/dL is 7.0 mmol/L and 200 mg/dL is 11.1 mmol/L. The US uses mg/dL; Canada, the UK, Australia and most of Europe use mmol/L.
Three common reasons. A meter average only includes the moments you tested, usually fasting, while eAG covers every hour including after meals. The ADAG formula itself has a spread of about plus or minus 30 mg/dL between individuals. And conditions that change red blood cells, such as iron deficiency, hemolysis, recent blood loss, kidney disease or a hemoglobin variant, shift A1c without changing glucose. If the gap is large, tell your clinician; a CGM average or a fructosamine test can help sort it out.
This calculator is for general information and is not medical advice. Results are estimates from population formulas and can be off for you personally. Talk to a clinician before acting on a number, especially if you take medication or have a diagnosed condition. Editorial policy · Medical disclaimer
The trial numbers, why timing matters more than distance, and how to fit three short walks into a normal workday.
Why the first meal sets the day's hunger, what 30 grams looks like on a plate, and three breakfasts that get there without a shake.
Bone density, hearing, colon, eyes, skin, blood pressure, vaccines, strength. Eight appointments, one year, with what each one catches.